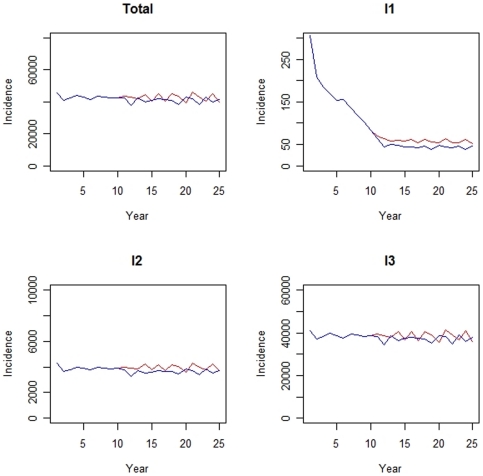
Figure 3. Absolute number of pertussis cases (incidence) for a population 150.000 persons after implementation of booster vaccination at the age of 4 years (t = 0) assuming natural immunity wanes after 15 years.
The situation with adolescent vaccination at t = 10 and the current situation without adolescent vaccination are represented by the red and blue lines, respectively. I1 = primary infection, I2 = recidive infection, I3 = asymptomatic infection and Total = I1+I2+I3. Note the different scales of the y-axis for each infection type.

