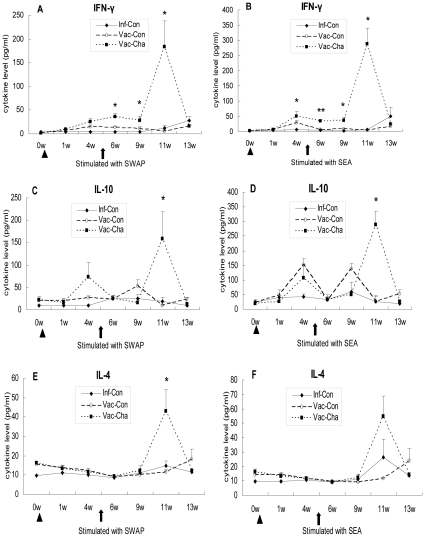
Figure 6. IFN-γ, IL-10 and IL-4 produced by PBMC stimulated with SWAP and SEA.
Triangles and arrows show the times of immunization and infection, respectively. *P<0.05 and **P<0.01 for the Vac-Cha group compared to the Inf-Con group. Data are representative of two independent experiments with similar results (n = 7).

