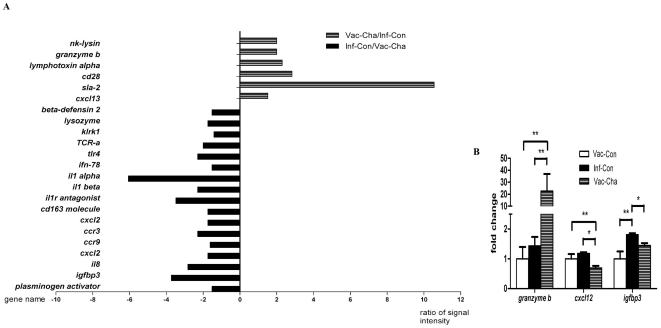
Figure 8. Relative mRNA signal intensities for certain genes of mesenteric lymph nodes in the Vac-Cha and Inf-Con groups assayed by microarrays and validated by qRT-PCR.
In figure 8A, the numbers along the X-axis represent the ratio of signal intensities between the Vac-Cha and Inf-Con groups. The positive values on the right-side X-axis: gene signal intensity of the Vac-Cha group/gene signal intensity of the Inf-Con group; the negative values of the left-side X-axis: gene signal intensity of the Inf-Con group/gene signal intensity of the Vac-Cha group. The gene names are listed along the Y-axis. Figure 8B shows the relative mRNA levels of granzyme b, cxcl12, and igfbp3 for the Vac-Con, Inf-Con and Vac-Cha groups. *P<0.05 and **P<0.01 (n = 3).

