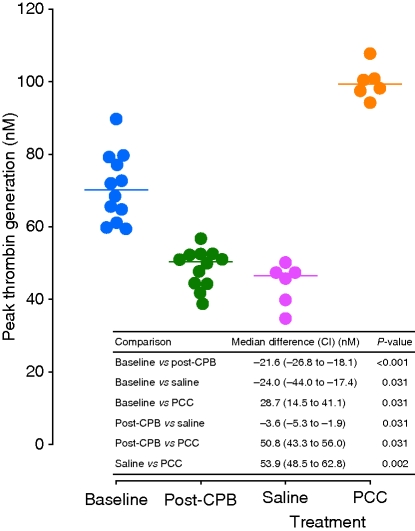
Fig 4.
Peak thrombin generation in individual animals at baseline and after CPB and subsequent administration of saline or PCC. Medians depicted as horizontal lines. In the table inset, grouped comparison indicated between saline and PCC; all other comparisons paired. CI, 95% confidence interval; CPB, cardiopulmonary bypass; PCC, prothrombin complex concentrate.

