
Figure 4.
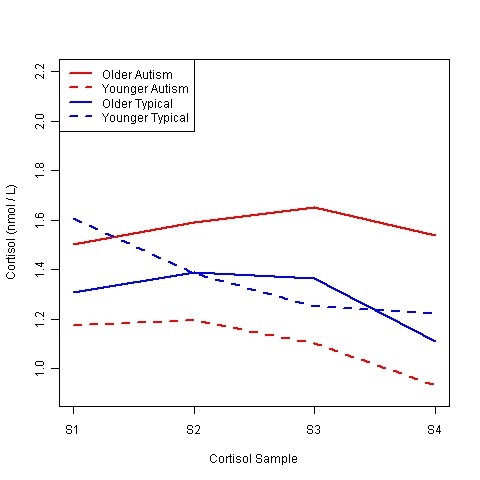
Group patterns of average cortisol response to the peer interaction. Figure age subgroups (Older, Younger) were separated by median age within each diagnostic group. S1 = Baseline (Preplay), S2 = Postplay, S3 = 20 minutes postplay, S4 = 40 minutes postplay. nmol/L = nanomoles per liter.