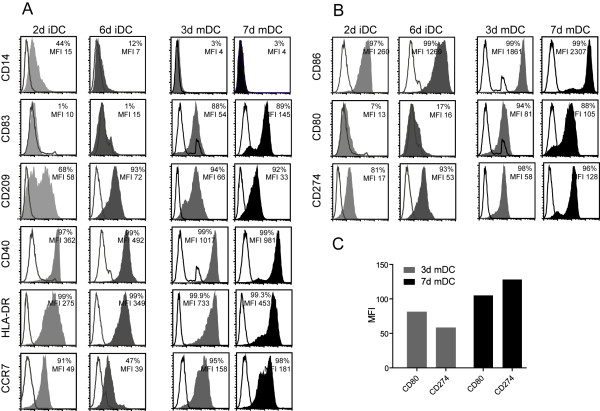
Figure 2.
Phenotype of immature and mature DC. The expression of cell surface molecules on 2d iDC, 6d iDC, 3d mDC and 7d mDC was detected with specific antibodies and analyzed by flow cytometry. The open histograms correspond to the isotype controls, whereas the grey and black histograms display the specific binding of FITC- or PE-coupled antibodies. (A) Expression of CD14, CD83, CD209, CD40, HLA-DR and CCR7. (B) Expression of the B7-family-members CD86, CD80 and CD274. (C) Comparison of the expression of the costimulatory molecule CD80 and the inhibitory molecule CD274 on 3d mDC and 7d mDC. Data are representative for three independent experiments.

