Figure 3.
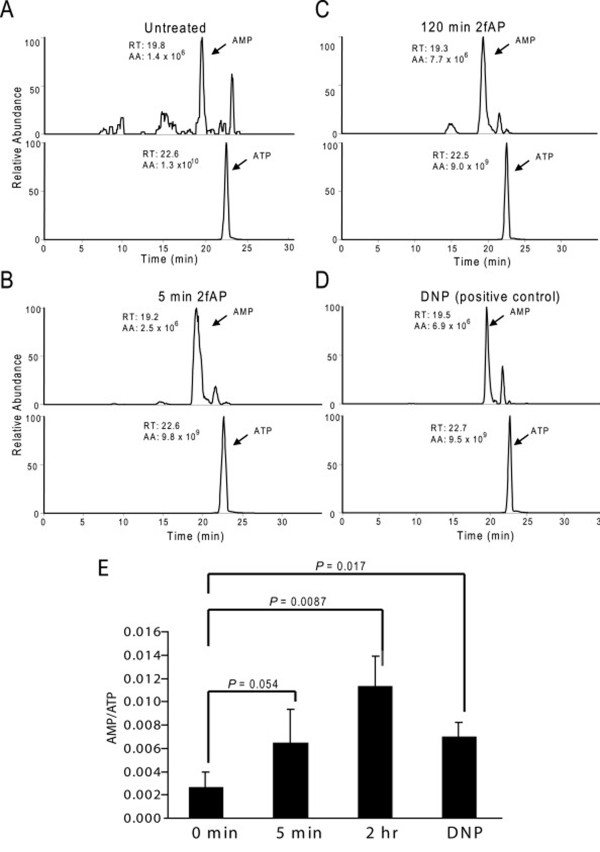
PAR2 increases cellular AMP/ATP levels. NIH3T3 cells were treated with 2fAP for 0-120 minutes or with DNP as a positive control. Nucleotides were extracted and analyzed by LC-ESI-MS/MS. A-D. Representative selected-ion chromatograms of ATP and AMP, shown above the peaks are the integrated peak area (AA) and retention time. E. Fold changes in AMP/ATP were calculated for each treatment group compared to untreated controls. The results were from three independent measurements.

