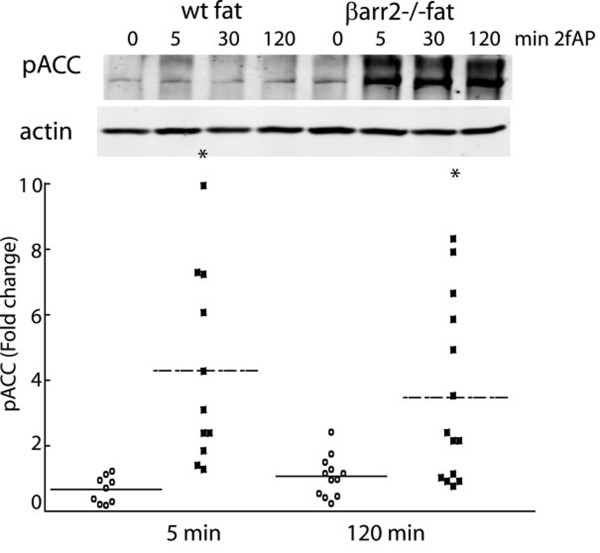
Figure 6.
PAR2 increases ACC phosphorylation in primary fat from β-arrestin-2-/- mice. Fat from wt and β-arrestin-2-/- mice, prepared as described in Figure 4 was analyzed by western blot for pACC (upper panel) or actin (lower panel). Dot-plots showing normalized fold changes relative to baseline in pACC for individual mice are shown below (Baseline (untreated) is equal to 1, and is not shown in the graph). *Statistically significant changes in mean pACC compared with wt mice (p < .001, n = 11).

