
Figure 2. CAND-1 expression pattern.
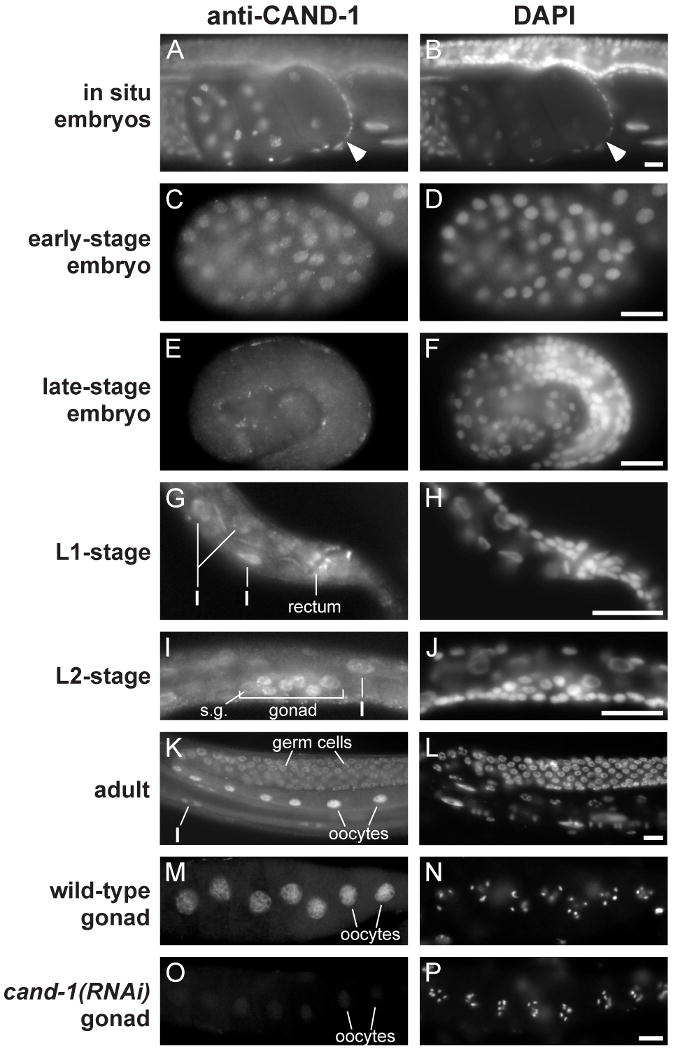
Images of wild-type animals stained with anti-CAND-1 antibody and DAPI. (A, B) in situ staining of early embryos. The one-cell stage zygote is denoted by an arrowhead, and has maternal and paternal pronuclei visible. (C, D) Early embryo at ∼100-cell stage. (E, F) A pretzel-stage embryo, which is the last of the defined embryo stages and has largely completed embryonic cell divisions and morphogenesis. Note that CAND-1 staining decreases in the older embryo. (G, H) The posterior of an L1-stage larva with CAND1 expression in the rectal epithelia and intestinal cells (I). (I, J) An L2-stage larva with CAND-1 staining in somatic gonadal cells (s.g.), germ cells, and intestine cells. (K, L) A wild-type adult with CAND-1 staining in germ cells, oocytes, and intestinal cells. (M-P) Dissected adult gonads from wild-type (M, N) and cand-1(RNAi) (O, P) hermaphrodite adults. Note that CAND-1 staining is significantly decreased in the cand-1(RNAi) gonad. Scale bars, 10 μm.