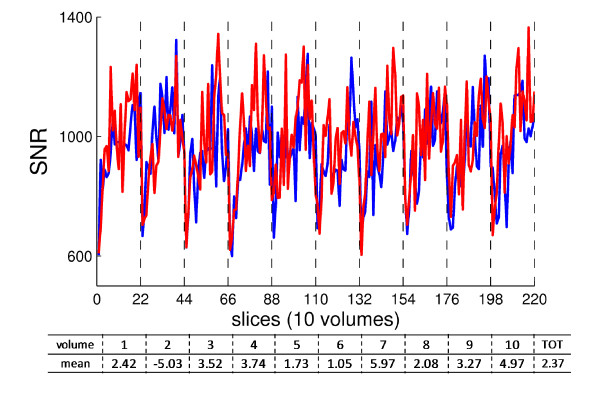
Figure 2.
SNR evaluation. From gradient EPI functional acquisition on phantom, SNR along with the 220 slices, split up into 10 volumes (vertical dashed lines). Red: reference condition; Blue: with motion capture system working within the scanner room. Under the plot: table with mean of ΔSNR for each volume, and the total mean one.

