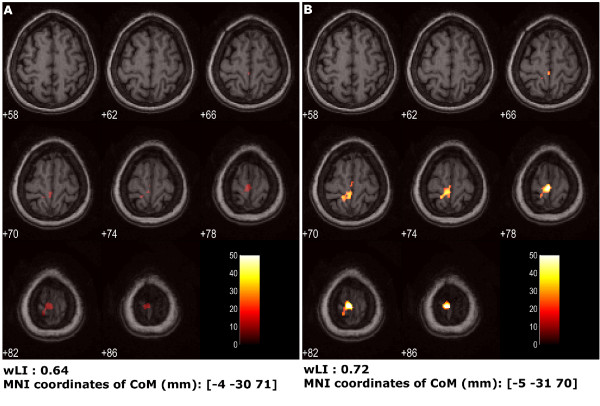
Figure 5.
Cortical maps of patient's healthy foot pre-rehabilitation session, comparison between the two model designs. Activation for patient's healthy foot at hospitalization, eight transversal slices centered around z = 72 mm are shown (slice thickness = 4 mm). A) activation found using standard design matrix for statistical analysis; B) activation found using the design matrix with the kinematic regressor. Under each one, wLI and coordinates of the Center of Mass (CoM) of activated areas are reported.

