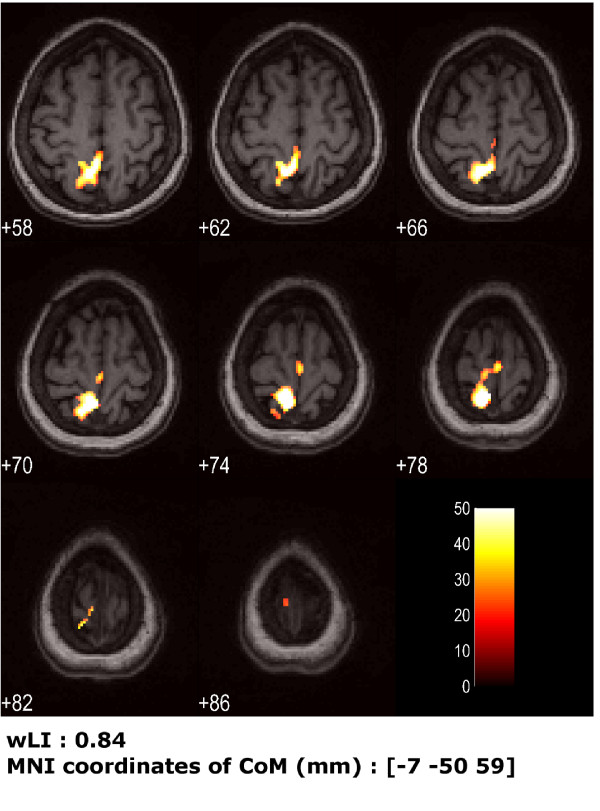
Figure 6.
Cortical maps for patient's healthy foot post-rehabilitation session, using the kinematics into the model design. Activation for patient's healthy foot (right) after one month (obtained using standard design matrix), from analysis taking into account the actual kinematics. Eight transversal slices centered around z = 72 mm are shown (slice thickness = 4 mm). Under the figure, wLI and coordinates of the Center of Mass (CoM) of activated areas are reported.

