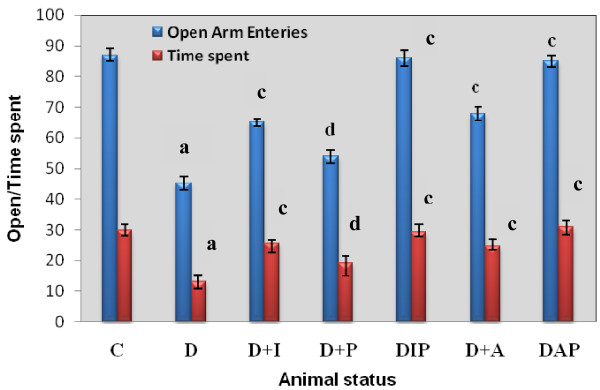
Figure 8.
Representative graph showing behavioural response in streptozotocin induced diabetic Rats: Effects of insulin and pyridoxine treatment in Time Spent in Open Arm Entry attempts (Counts/5 minutes) by control and experimental rats in Elevated plus- maze test by of control and experimental rats. Values are mean ± S.E.M of 4-6 separate experiments. Each group consists of 6-8 rats. a p < 0.001 when compared to control group; c p < 0.01, d p < 0.001 when compared to diabetic group.

