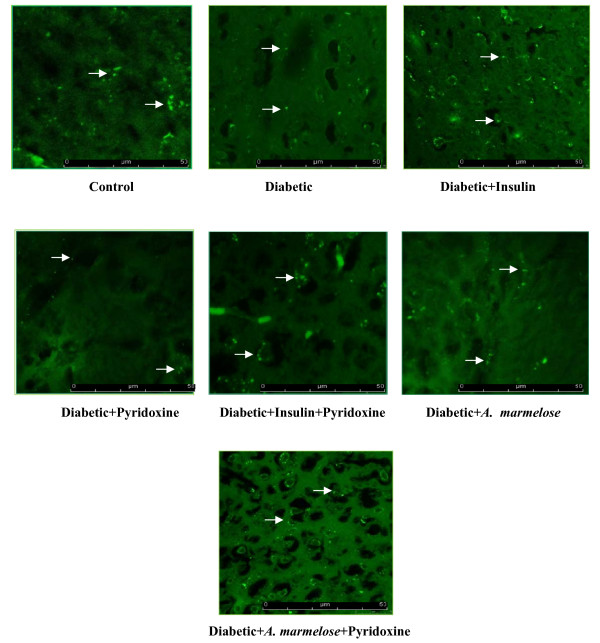
Figure 9.
Confocal image of 5-HT2A receptors in the hippocampus of control and Experimental rats using immunofluorescent 5-HT2A receptor specific primary antibody and FITC as secondary antibody. The pixel intensity of The pixel intensity of control - 384132 ± 1454, diabetic - 133475 ± 1431 a, diabetic+Insulin - 229123 ± 1453 a, c, diabetic+pyridoxine - 151012 ± 2662 a, b, diabetic+insulin+pyridoxine - 398791 ± 2105 c, diabetic+Aegle marmelose - 222921 ± 1097a, c and diabetic+Aegle marmelose+pyridoxine - 314997 ± 1084 c. Values are mean ± S.E.M of 4-6 rats in each group. Each group consists of 6-8 rats. a p < 0.001 when compared to control group; b p < 0.05, c p < 0.001 when compared to diabetic group. There was significant reversal of 5-HT2A receptor to near control level on treatment with pyridoxine alone and in combination therapy with insulin and Aegle marmelose compared to diabetic rats. Arrow in white shows 5-HT2A receptors.

