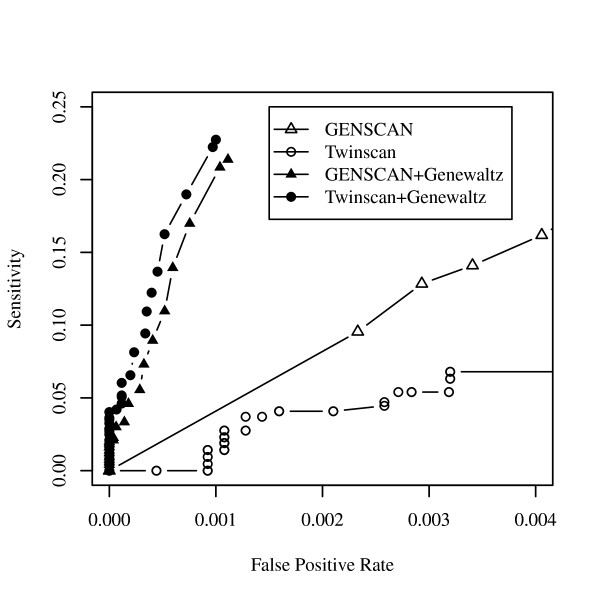
Figure 4.
The partial receiver operating characteristic (partial ROC) curves using Twinscan and GENSCAN across several GeneWaltz p-value thresholds. A partial ROC curve plots the true positive rate for recovering true causal single-nucleotide polymorphisms (SNPs, y-axis) and the false positive rate (x-axis) over a range of small values of false positive rates.

