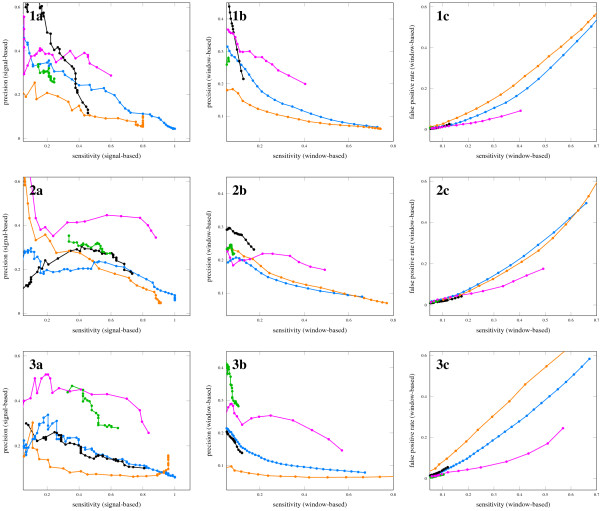
Figure 3.
Prediction performance of five methods in Escherichia coli, Listeria monocytogenes and Streptococcus pyogenes. Species 1a-c are results for Escherichia coli, 2a-c for Listeria monocytogenes, 3a-c for Streptococcus pyogenes. Blue graph: RNAfold-Zscore, threshold varied from 0 to 8.2 in steps of 0.2. Black graph: RNAz, probability score threshold varied from 0 to 0.9 in steps of 0.1, 0.9 to 0.99 in steps of 0.01, 0.99 to 0.999 in steps of 0.001, 0.999 to 0.9999 in steps of 0.0001, 0.9999 to 0.99999 in steps of 0.00001. Orange graph: Dynalign, alignment score threshold varied from 0 to 700 in steps of 20. Green graph: TranstermHP, confidence score varied from 70 to 100. Pink graph: combined method, score threshold varied from 0 to 1.5 in steps of 0.05.

