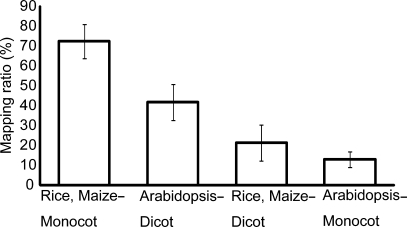
Figure 3.
Relationship between species classification and mapping ratio. The horizontal axis indicates the classification, and the vertical axis indicates the mapping ratio. We mapped FLcDNAs from three monocots and four dicots to the O. sativa (rice) and Z. mays (maize) genomes, and FLcDNAs from three dicots and six monocots to the A. thaliana (Arabidopsis) genome. Bars at the top of the boxes represent the standard deviations.

