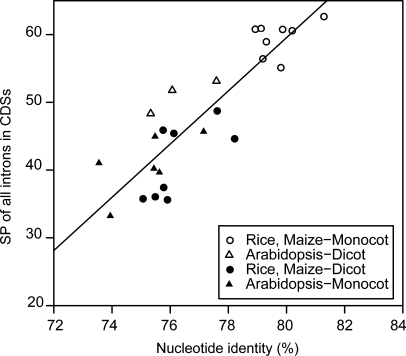
Figure 4.
Correlation between nucleotide identity and SP. The horizontal axis indicates the nucleotide identity, and the vertical axis indicates the SP of all introns in CDSs. Open circles and triangles indicate within-monocot and -dicot mapping, respectively, and filled circles and triangles indicate between-dicot and -monocot mapping, respectively. The straight line shows the linear regression for all data (r = 0.88).

