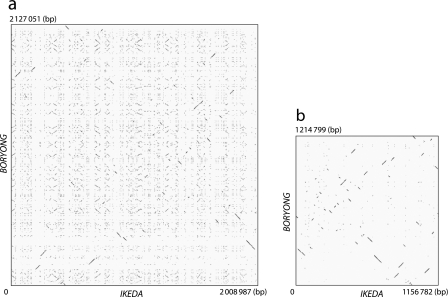
Figure 1.
Extensive shuffling of OT genomes induced by explosively amplified repetitive sequences. (a) Dot plot representation of DNA sequence homology between Ikeda and Boryong chromosomes. Explosively amplified repetitive sequences are scattered throughout the genomes in both strains, and it is therefore difficult to identify regions with colinearity between the two genomes. (b) Dot plot representation of DNA sequence homology for the repetitive sequence-free genomic sequences (RSFGSs) of the two strains. The RSFGSs were constructed by removing all repetitive sequences from each genome. By comparing the RSFGSs, extensive rearrangements of the core genome of OT can be clearly visualized. Each dot represents a high-scoring segment pair of E-value <1E−200, which was identified by BLASTN. The GenomeMatcher ver. 1.11 software16 was used for BLASTN analysis and visualization of the results.

