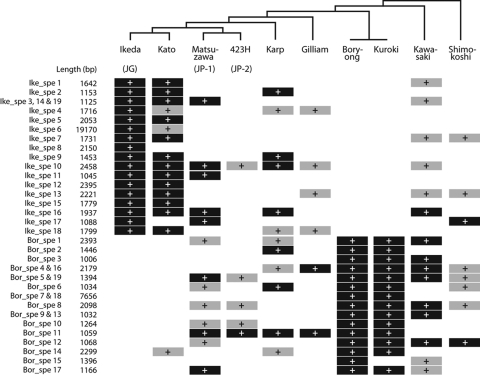
Figure 3.
Distribution of Ikeda- and Boryong-specific sequences among other OT strains. The presence of each strain-specific region (>1 kb) was examined by PCR scanning using two pairs of PCR primers, except for Ike_spe6, which was examined using six pairs of primers. Regions present in each strain are indicated by black cells with white plus signs. Regions where only one primer pair yielded a PCR product are indicated by gray cells with black plus signs. Regions yielding PCR products with different sizes compared with those of the reference strain (Ikeda or Boryong) are also indicated by gray cells. In Ike_spe6 of strain Kato, five primer pairs yielded PCR products. Phylogenetic relationships of the OT strains examined are also indicated (Fig. 5).

