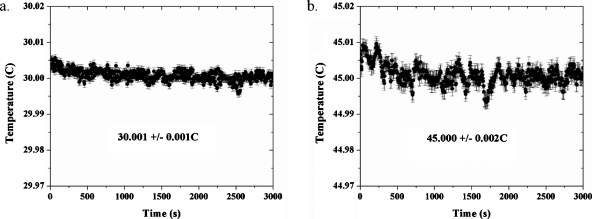
Figure 3.
Temporal stability of the temperature for a fixed location in the sample bath. The sample temperature at a fixed location is stable to within milli-Kelvins of the set-point temperature for periods of hours. The temperatures displayed in the insets are the recorded temperatures; the set point temperatures were (a) 30.000 °C and (b) 45.000 °C. Each graph depicts one run only; thus, the error bars depicted on the graphs for the actual temperature (vs setpoint temperature) refer to the standard deviations of time averages of the temperature readings. Therefore, all are the same in length for a given data set.

