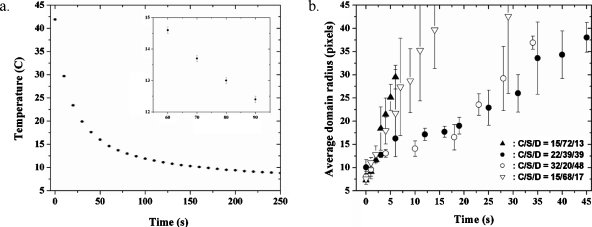
Figure 6.
Quench data. (a) An example of the temperature (°C) reading near the sample vs time (second) for a quench experiment. The inset shows the error bars up close. (b) Average domain radius (pixels) vs time (second) for four different compositions quenched below the Lo-Ld miscibility gap. The error bars in (a) reflect the uncertainty in the thermometer (±0.1 °C) only; thus, they are of constant length for all data points. The error bars depicted in (b) reflect the standard deviations of the sample averages.

