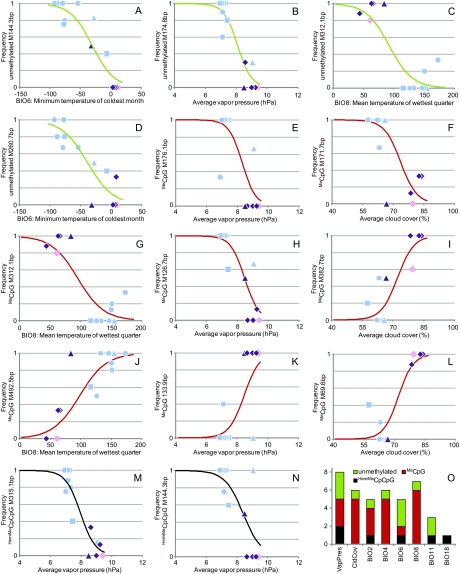
FIG. 2.
Loci under selection as indicated by SAM (Joost et al. 2007). (A–N) Graphs of the logistic sigmoid functions, symbolized with lines, corresponding to relevant pairs of epigenetic markers and their most significantly associated environmental variable (table 1). Symbols indicate the observed within-population frequency of the given marker for the corresponding value of the investigated ecoclimatic parameter. The shape and color of the symbols follow figure 1. (O) Histogram showing the environmental variables that significantly explain patterns of alternative epialleles. Some methylation markers are associated with more than one ecological variable (table 1).

