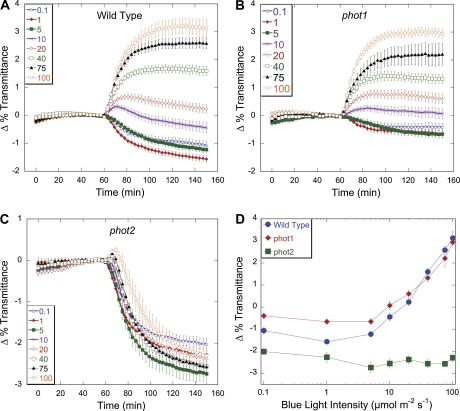
Fig. 1.
Time-course of fluence responses of light-induced chloroplast movements in leaves of wild type and phot1 and phot2 mutants. (A–C) Red-light transmittance was measured for 60 min in dark-acclimated leaves to establish a baseline before a 90 min blue-light treatment was initiated. Red-light transmittance was recorded every 3 min. The data are the average ±SE of 5–15 leaves per light treatment. (D) Fluence response curves from the final transmittance changes from (A), (B), and (C) of wild type, phot1, and phot2 after 90 min blue light treatments. (This figure is available in colour at JXB online.)

