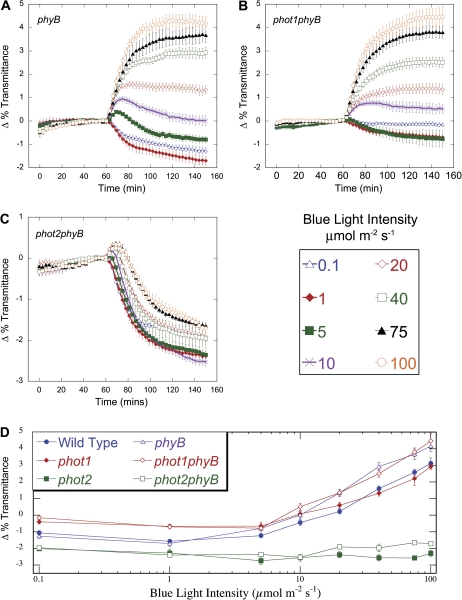
Fig. 4.
Time-course of fluence responses of light-induced chloroplast movements in leaves of wild type and phyB, phot1phyB, and phot2phyB mutants. (A–C) Red-light transmittance was measured for 60 min in dark-acclimated leaves to establish a baseline before a 90 min blue-light treatment was initiated. Red-light transmittance was recorded every 3 min. The data are the average ±SE of 5–15 leaves per light treatment. (D) Final red-light transmittance changes in, phot1, phot2, phyB, phot1phyB, and phot2phyB after 90 min exposures to single fluence-rates of blue light (from Fig. 1A–C and Fig. 4A–C). (This figure is available in colour at JXB online.)

