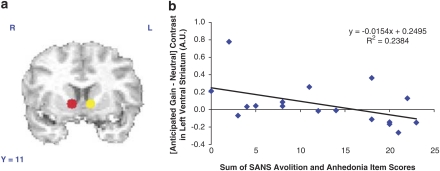
Figure 2.
ROI analyses of reward anticipation responses. (a) ROIs in left (yellow; −8, 12, 0) and right (red; 11, 11, 0) ventral striatum (VS), based on the work of Knutson et al (2001). (b) Scatter plot showing correlation between patients' summed avolition and anhedonia scores from the SANS and activity related to anticipated gains in left VS. Patients with higher ratings of negative symptoms showed more blunted activity related to anticipated gains.

