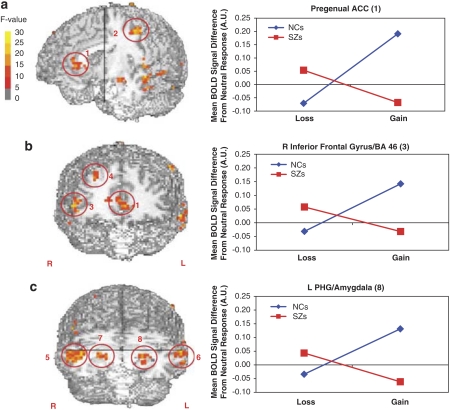
Figure 3.
Brain regions showing significant group × outcome valence interactions. In all areas, controls showed more positive responses to gains than to losses. Patients, by contrast, showed either similar activations to large gains and losses, or reduced responses to gains, relative to losses. Color scale shows voxel-wise F-value, with functional images thresholded at F=11.5 (p=0.001). (a) BOLD responses to negative and positive outcomes by patients (red lines) and controls (blue lines) shown in medial PFC/pregenual ACC (region 1, Talairach coordinates: −1, 41, 5). A similar pattern was observed in the left precentral gyrus (2: −50, −3, −44). Anatomical image cut at x=3, y=−7. (b) BOLD responses by patients and controls shown in the right inferior frontal gyrus (3: 50, 43, 4). A similar pattern was observed in the right superior frontal gyrus (4: 29, 43, 38). Anatomical image cut at y=41. (c) BOLD responses by patients and controls shown in the left amygdala (8: −23, −13, −15). Similar patterns were observed in the right amygdala (7) and middle temporal gyrus/BA 21, bilaterally (5 and 6; see Table 2 for coordinates). Anatomical image cut at y=−11, z=−7.

