Figure 7.
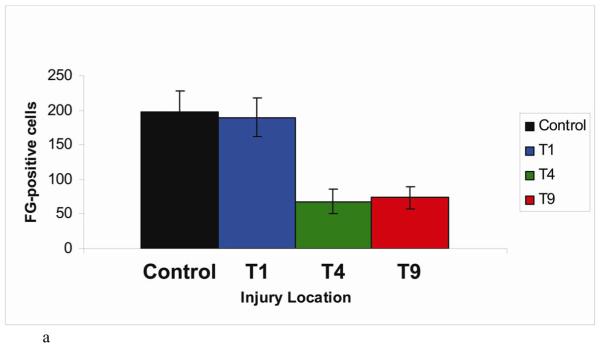
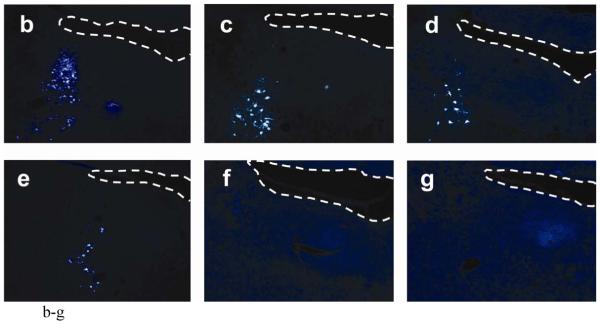
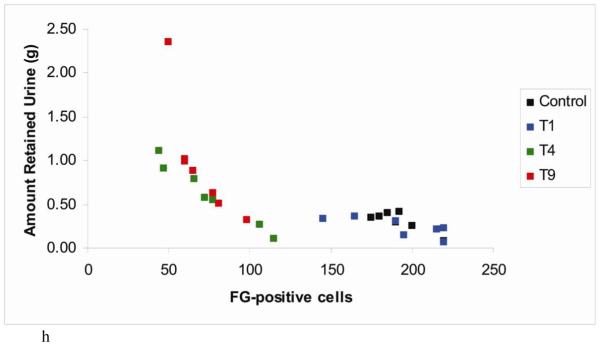
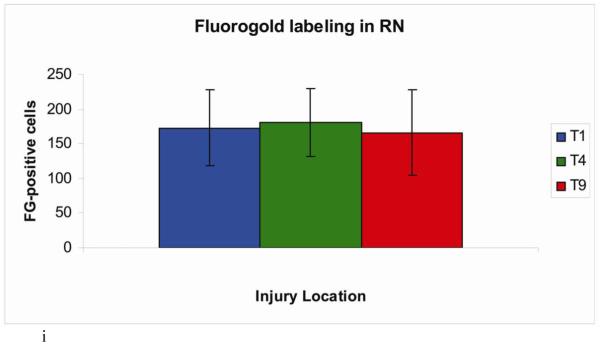
Demonstration of retrograde labeling in the pontine micturition center following SCI. (a) The number of Fluorogold positive cells in the PMC after injury. (b-e) Representative images of FG-labeled cells in a control animal and following contusion injury at T1, T4, or T9. (f-g) Representative images of FG-labeled cells following crush injury at T1 or T9. (h) Correlation plot showing number of FG-positive cells vs. amount of retained urine on the day of FG injection. (i) The number of Fluorogold positive cells in the red nucleus after contusion injury.
Note: Although FG counts were bilateral, only one side of PMC is shown in figure.


