
Figure 2.
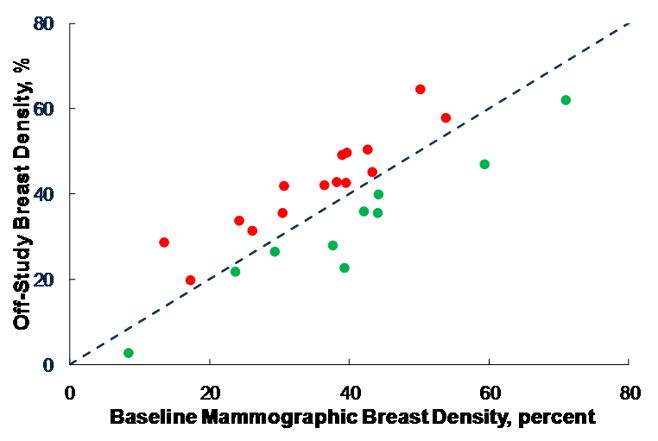
Change in mammographic breast density (expressed as percent of breast area that is considered to be at increased density) over the course of the 12 month study. The triangles indicate subjects where density increased; the squares indicate subjects where density decreased. The dashed line indicates equivalence, i.e., no change over the course of the study. The difference in density is not statistically significant by Wilcoxon’s sign rank test.