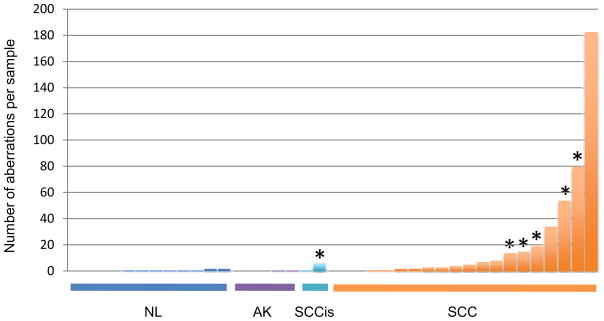
Figure 1. Distribution of gene copy number aberrations in examined tissues.
aCGH was performed and a total number of genomic aberrations was calculated for each examined sample. The bars represent individual samples, which are clustered according to the tissue type, from left to right, including normal skin (NL), actinic keratoses (AK), SCC in situ (SCCis) and invasive SCC (SCC). Within each cluster, individual samples are sorted from left to right, according to the number of gene copy aberrations per sample. Asterisk (*) designates samples harboring INPP5A deletions.

