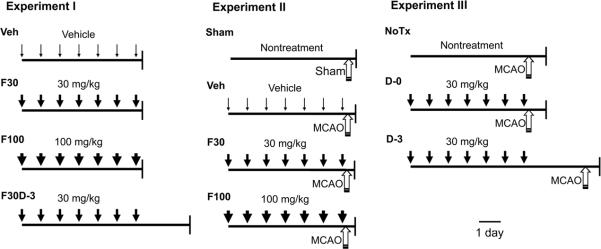
Fig. 1.
Schematic diagram showing experimental designs. Experiment I measured SOD gene expression and enzymatic activity levels in nonischemic animals. Vehicle (Veh) or fenofibrate [30 mg/kg (F30) or 100 mg/kg (F100)] was administered for 7 days and brains were collected at 1 hour after the last administration. F30D-3, fenofibrate (30 mg/kg) was given for 7 days and brains were collected on post-discontinuation day 3 (D-3). Experiment II measured oxidative stress in ischemic brain at 30 minutes after reperfusion following 60 minutes of MCAO. Animals were treated with Veh, F30, or F100 for 7 days and subjected to MCAO at 1 hour after the last drug treatment. Sham, non-fenofibrate treated animals were subjected to sham surgery under anesthesia. Experiment III measured stroke outcome after 24 hours of reperfusion following 60 minutes of MCAO. NoTx, non-fenofibrate treated animals were subjected to stroke. D-0, animals were treated with fenofibrate (30 mg/kg) for 7 days and were subjected to stroke at 1 hour after the last fenofibrate administration. D-3, animals were treated with fenofibrate (30 mg/kg) for 7 days and were subjected to stroke 3 days after the last administration. Downward arrow and upward arrow indicate fenofibrate administration and MCAO, respectively. Scale bar, 1 day.

