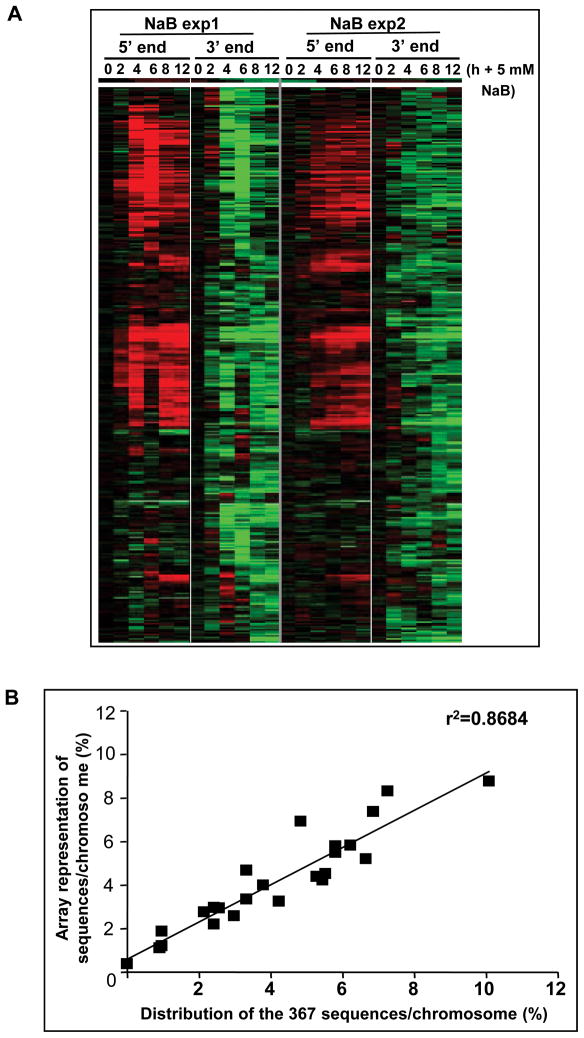
Figure 4. Transcript expression of sequences downregulated by butyrate, assessed by the “5′ 3′ microarray”.
(A) A total of 367 sequences were downregulated by NaB at 2–12 hrs of treatment (Methods). Data are expressed as the ratio of NaB-treated to untreated cells at each time point of treatment for the 5′ end, while the 3′ end data are expressed relative to the 5′ end, as the “ratio of ratios” (Methods). A heat-map of two independent experiments is shown. Red and green indicate upregulation and downregulation in response to butyrate, respectively, while black indicates no significant change. (B) Chromosome distribution of the 367 sequences downregulated by butyrate at the 3′ end relative to the sequence representation on the array.

