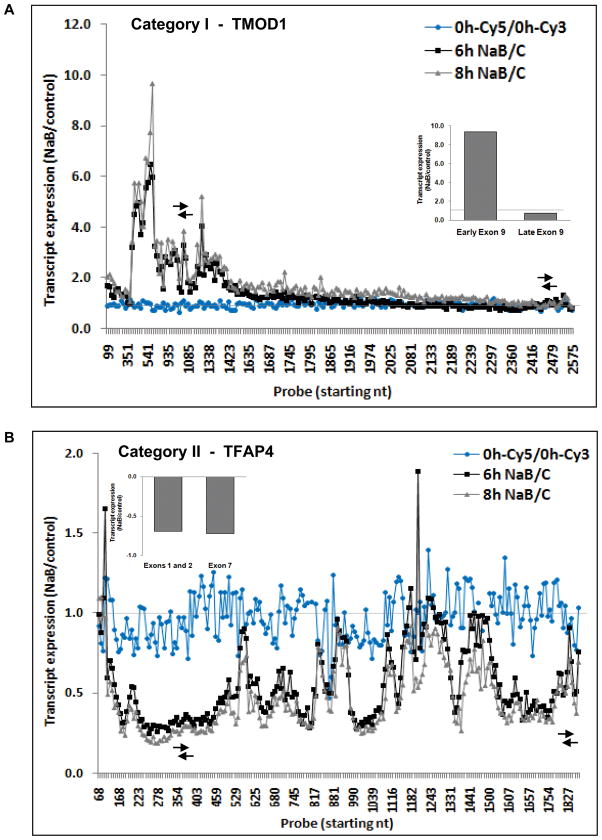
Figure 5. Transcript expression patterns of genes downregulated by butyrate, assessed by the “Tiling” microarray.
Category I (A) and category II (B) sequences from Table I are exemplified by TMOD1 and TFAP4 genes, respectively. Data are expressed as the ratio of NaB-treated to untreated cells. Arrows indicate the regions analyzed by qRT-PCR (inset, data as NaB-treated to untreated cells).

