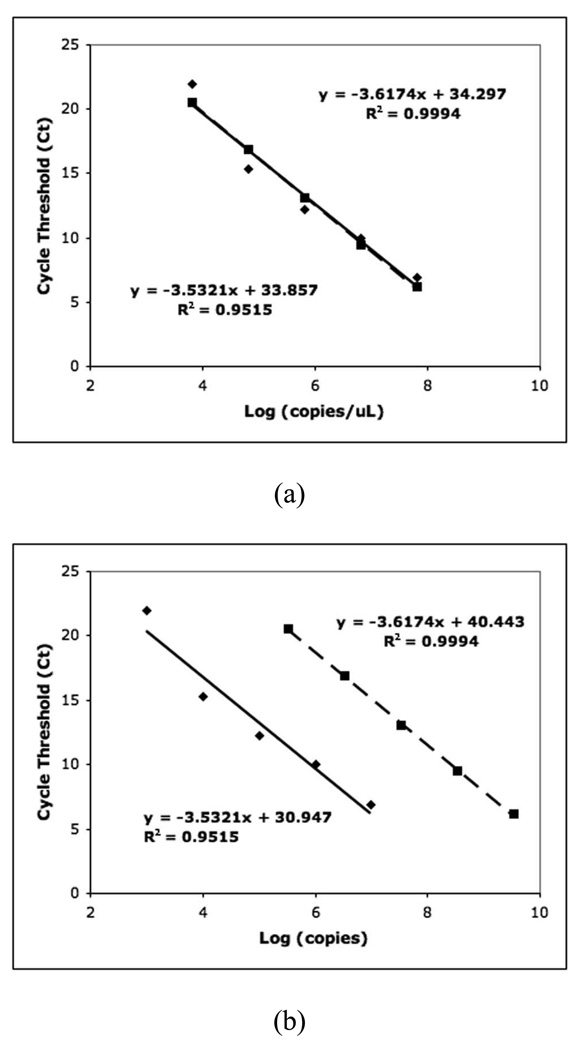
Fig.9.
(a) Cycle threshold versus logarithm of template DNA concentration (copies/µL). (b) Cycle threshold versus logarithm of template DNA copy number. In both (a) and (b), ◆ denotes the data obtained using the microdevice, and ■ denotes the data generated on a benchtop instrument; the equation in the top right is for the trendline (dash line) of the benchtop data, and the equation in the bottom left is for the trendline (solid line) of the on-chip data. The benchtop reaction volume is 50µL.

