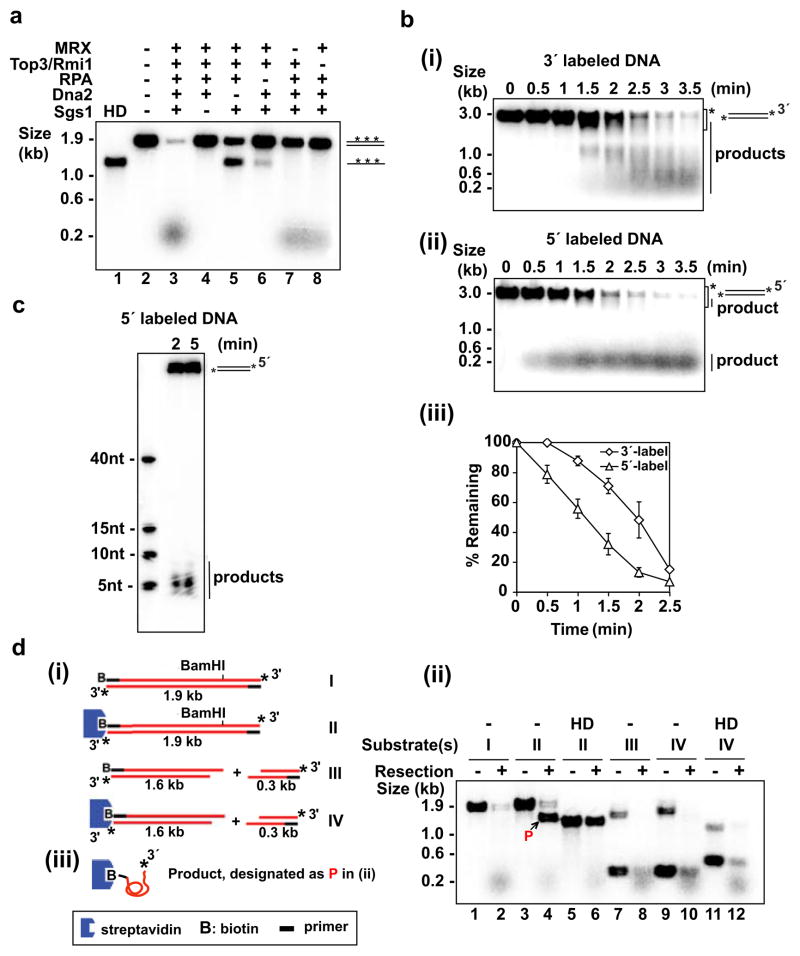
Figure 1. Reconstitution and 5′ polarity of DNA end resection.
a, Resection of uniformly labeled DNA. Symbol: HD, heat denaturation of DNA.
b, Time course analysis of resection with 3′-labeled (i) or 5′-labeled (ii) DNA. Mean values ±SD from three independent experiments were plotted (iii). The asterisk in (i) and (ii) marks the area that was quantified.
c, Analysis of the initial 5′ resection product in a denaturing polyacrylamide gel.
d, The biotinylated substrates (i) were incubated with the resection machinery for 5 min as in (a) and analyzed (ii). Complete digestion of the unblocked 5′ strand yielded ssDNA (designated P in (ii) and depicted in (iii)) that harbored biotin-streptavidin at the 5′ terminus and 32P at the 3′ terminus.

