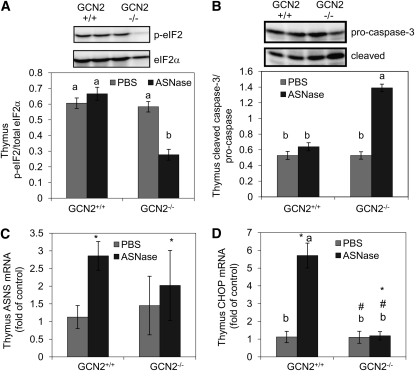
FIGURE 2.
Western blots (A,B, upper panel) and mean values (A,B, lower panel) for protein expression levels of eIF2 phosphorylation (A) and caspase-3 cleavage (B) and mRNA expression levels of ASNS (C) and CHOP (D) in the thymus of GCN2+/+ and GCN2−/− mice administered ASNase at 3 IU/g body weight or PBS for 6 d. Values are means ± SEM, n = 6. #Different from corresponding GCN2+/+, P < 0.05; *different from corresponding PBS, P < 0.05. When the genotype × ASNase interaction was significant, labeled means without a common letter differ, P < 0.05.

