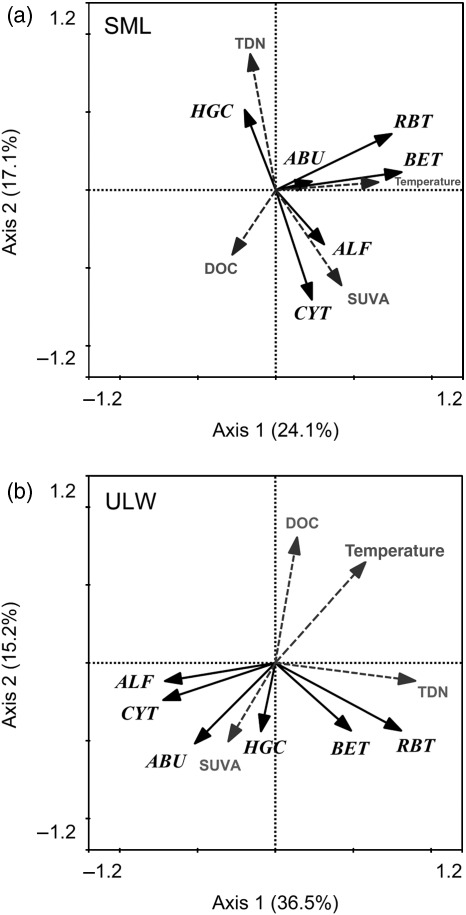
Fig. 3.
RDA biplots of selected physicochemical and biological parameters for the SML (a) and the ULW (b). The eigenvalues of the two axes are given in parentheses. DOC, dissolved organic carbon; SUVA, DOC-specific UV absorption at 254nm; TDN, total dissolved nitrogen; ABU, bacterial abundance; BET, Betaproteobacteria; RBT, R-BT subgroup of Betaproteobacteria; HGC, Actinobacteria; ALF, Alphaproteobacteria; CYT, Cytophaga-like bacteria. Analysis based on the absolute abundance of the different bacterial groups.

