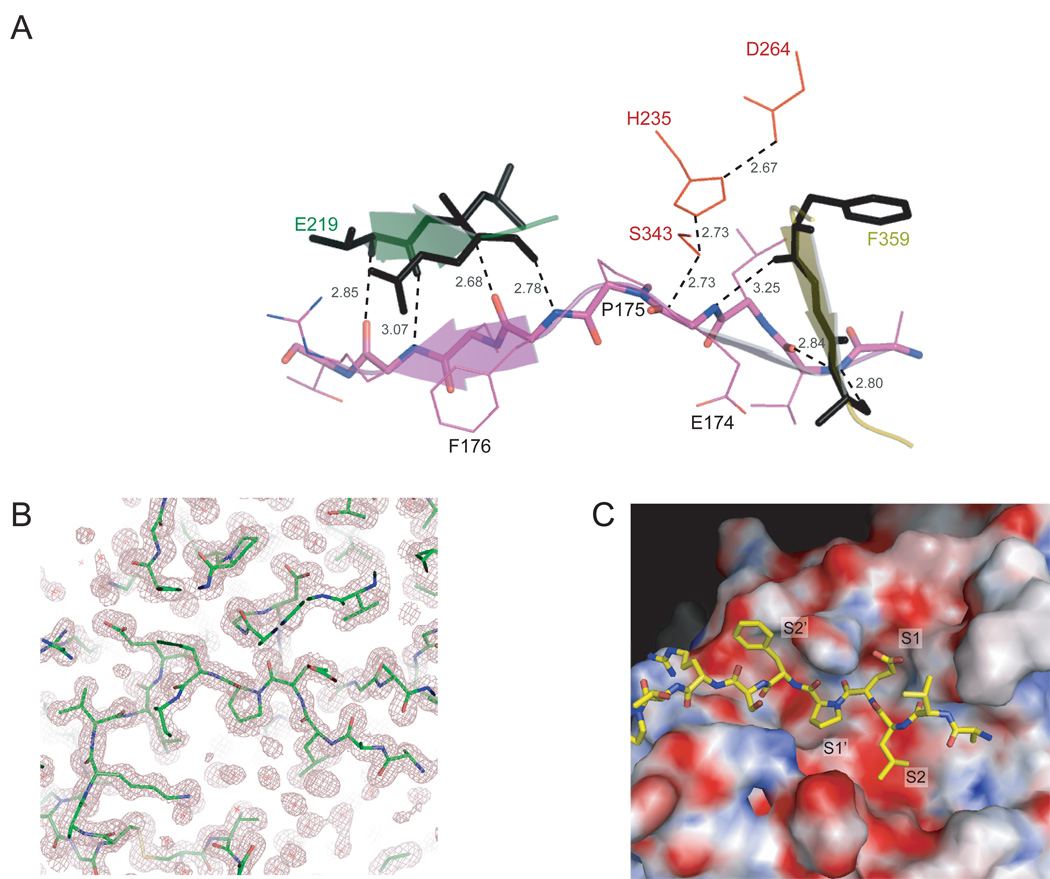
Figure 7.
The active site of Rv3671c protease with a bound peptide. A. A mixed cartoon-stick view of the peptidic substrate mimic (residues 171–179 of the N-terminal region) bound in the catalytic pocket of Rv3671c protease. The residues of the catalytic triad are shown in red. The peptide backbone forms the β-sheet extensions (shown by the arrows) of the N-terminal and the C-terminal β-barrel subdomains. The hydrogen bonds to the peptide backbone and bonds relevant for catalysis are shown by the dashed lines, together with their distances in Ǻ. B. 2Fo-Fc electron density map (contoured at 1σ) of the active site demonstrates the bound peptide and the oxyanion hole. C. Surface electrostatic potential of the active site. Positively charged, negatively charged and hydrophobic regions are shown in blue, red and white, respectively.

