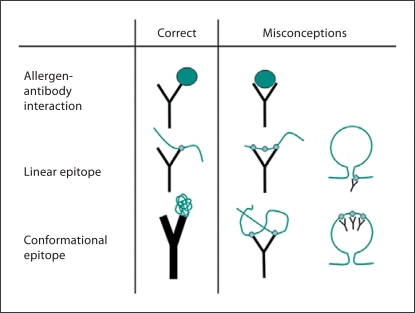
Fig. 1.
Representations of allergen-antibody interactions and linear and conformational epitopes. The allergen and the epitopes are shown as a big cyan sphere and small spheres, respectively. Correct representations and misconceptions are on the left and the right, respectively. The fragment of allergen connecting the 2 Fab of the antibody and containing 3 small spheres is a misinterpretation of a linear epitope (second row, second column).

