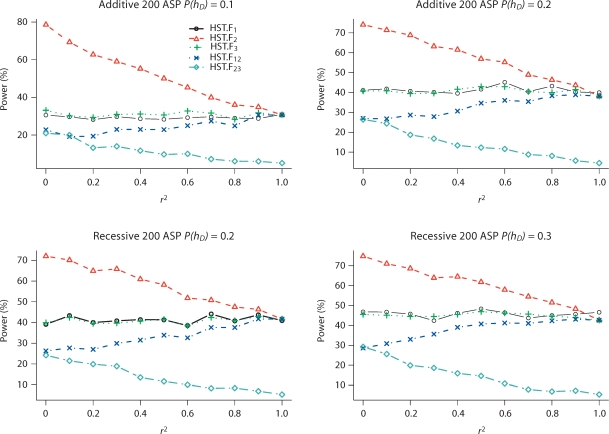
Fig. 4.
Power (in percentage) of HST.F to reject SNP pairs that do not fully explain the IBD sharing at a 5% significance level for additive and recessive models. SNPs 1 and 3 are two independent and equally contributing disease SNPs; SNP 2 is in LD with SNP 1, but in LE with SNP 3. P(hD) is the risk haplotype frequency. r2 is the LD between SNPs 1 and 2. Results are based on 1,000 replicates. HSTMLB.F has similar power to HST.F and is not included. We use subscripts to indicate which SNPs were analyzed; for example, HST.F12 means that SNPs 1 and 2 were used to determine parental homozygosity status when computing the HST.F statistic.

