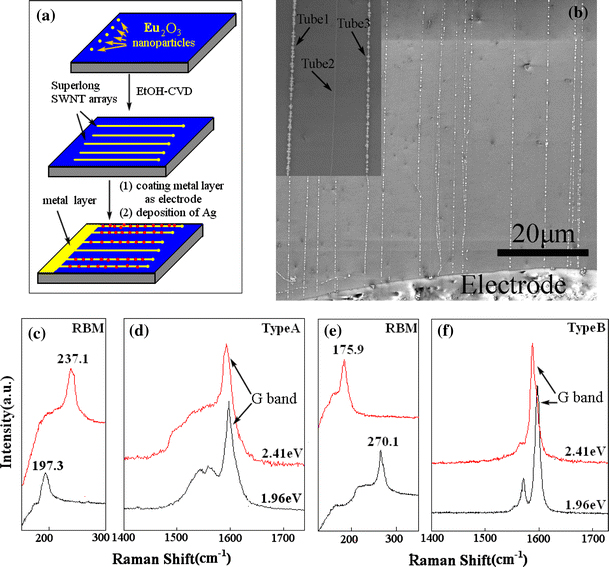
Figure 6.

a Schematic representation of the process from coating the catalyst precursor to the electrodeposition of silver on SWNT arrays. b SEM image of the superlong well-oriented SWNT arrays after Ag deposition. Inset is the amplified image showing the nanotubes with and without Ag deposition. Raman spectra from isolated individual SWNTs using two different excitation laser lines of 2.41 and 1.96 eV: c RBM and d G-band features of type A, e RBM and f G-band features of type B
