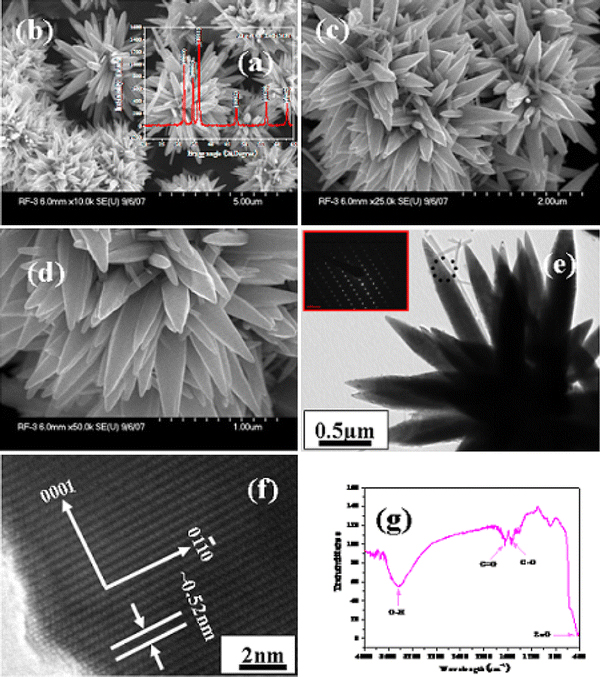
Figure 1.

a shows the typical X-ray diffraction pattern of grown zinc oxide micro-flowers (ZnO-MFs) composed of hexagonal nanorods, b, c shows the low magnification and d shows the high magnification FESEM images of ZnO-MFs e shows the low magnification TEM image of ZnO-MFs and inset presents the SAED (selected area electron diffraction) pattern of grown ZnO nanorods whereas f presents the HR-TEM image and it shows that the lattice difference between two fringes is ~0.52 nm g presents the typical FTIR spectrum of grown ZnO-MFs
