
Fig. 1.
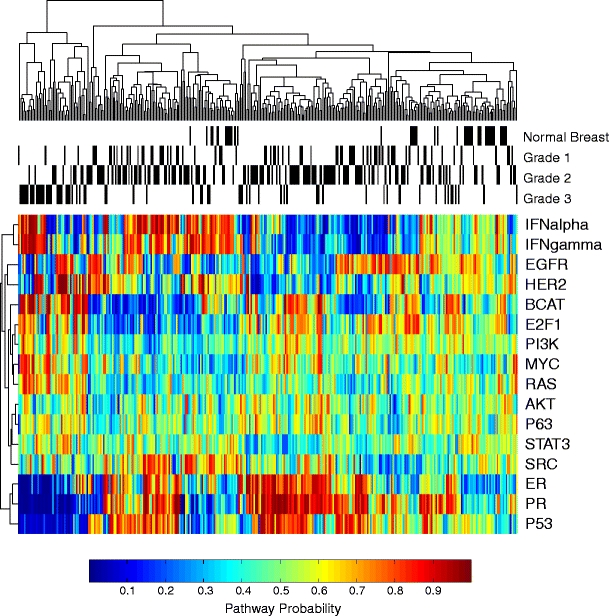
Signaling pathway probability in human tumors. Human breast cancer gene expression data from previous studies were downloaded (GSE4922 and GSE15852), normalized and the two datasets were merged together using the Affymetrix housekeeping genes to standardize between batches. The combined dataset was then examined for patterns of signaling pathway activation. Upon generating signaling pathway activation probabilities, the data was clustered and the resulting heat map is shown for the pathways indicated at the right. For a given pathway, blue represents a low probability of pathway activation while red represents a high probability of activation. These datasets also included clinical status for the grade of the tumor (1, 2, 3) and in one dataset normal breast samples were included (GSE15852). This additional clinical data is shown in the legend above the heat map. Using only signaling pathway probabilities, the heterogeneity within human tumors is readily apparent