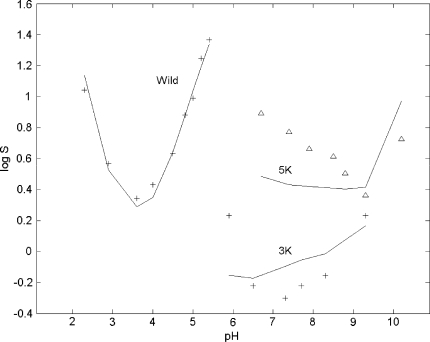
Fig. 3.
Plot of the measured and estimated log S as a function of pH. Estimated values were determined from Model 1. Training data from the wild type and 3K variant is shown as crosses. Experimental solubilities in the test set (5K variant) are shown as triangles. Estimated values are shown with lines

