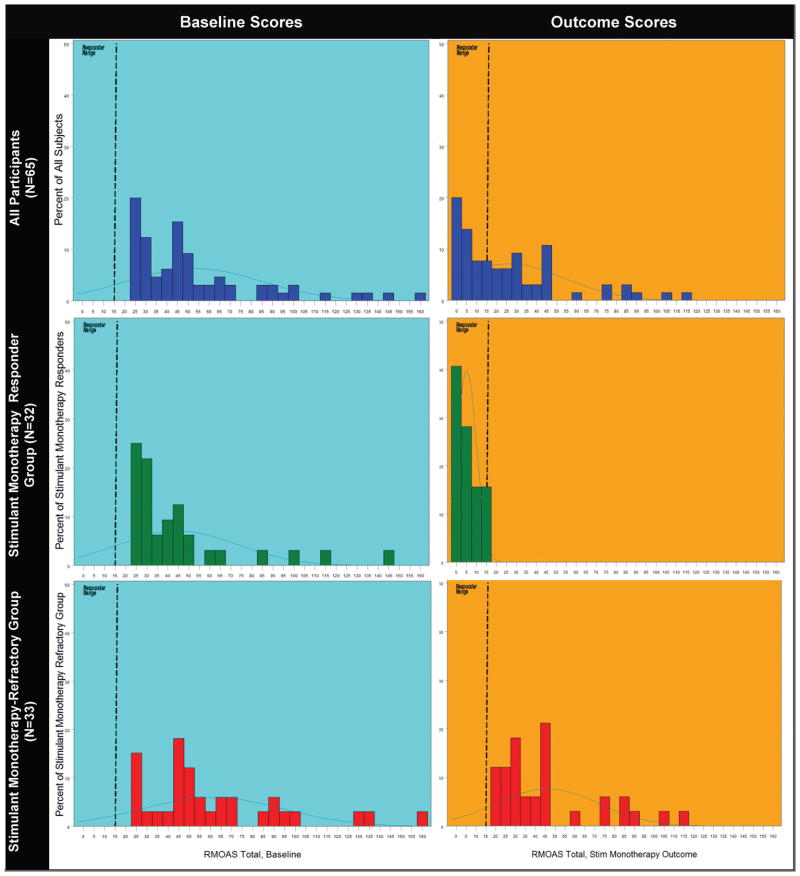
FIGURE 2.
Distributions of baseline and outcome R-MOAS scores for total sample and stimulant-responsive and stimulant-refractory subgroups. Left column presents baseline values, and right column shows scores at the end of stimulant optimization phase. Top row shows all subjects, middle row children whose aggression remitted with stimulant monotherapy, and the bottom row those whose aggression persisted.

