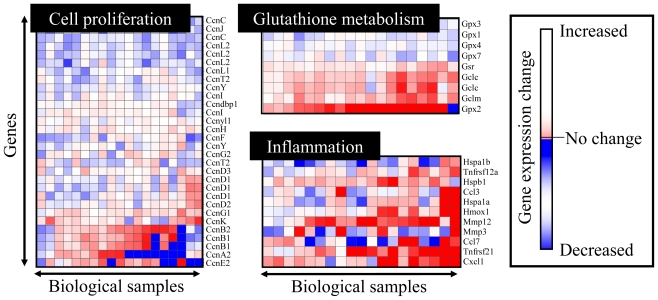
Figure 1.
Expression profiling for toxicogenomic biomarker gene sets. Gene sets whose expression levels are closely associated with cell proliferation, glutathione metabolism and inflammatory responses are presented. The heat map represents gene expression changes, where up-regulation, no change and down-regulation are colored in red, white and blue, respectively.

