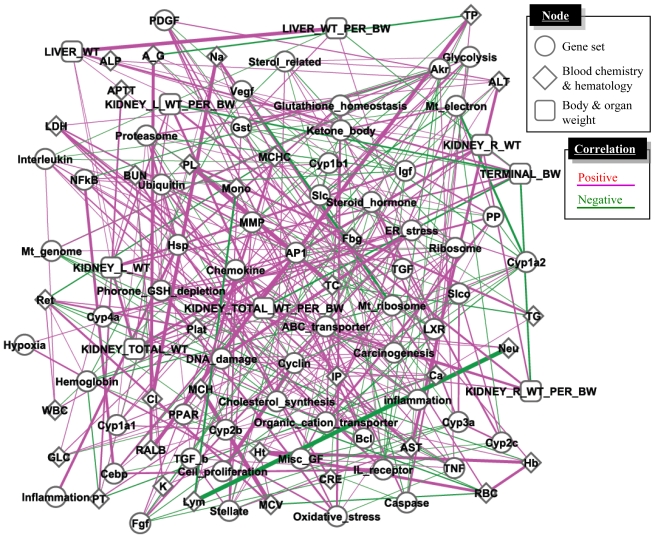
Figure 4.
Gene set- and phenotype-level network analysis. A large-scale TGx database, TG-GATE, was used for extracting statistically significant relationships among gene sets and phenotypes by utilizing a GGM algorithm. The network consists of D-scores for 58 gene sets, as well as changing levels of phenotype data such as organ weight, blood chemistry and hematology. Purple and green represent positive and negative partial correlation coefficients, respectively, and the width of the lines represents strength of the correlation measured with partial correlation coefficient. The network was drawn with open-source software Cytoscape.

