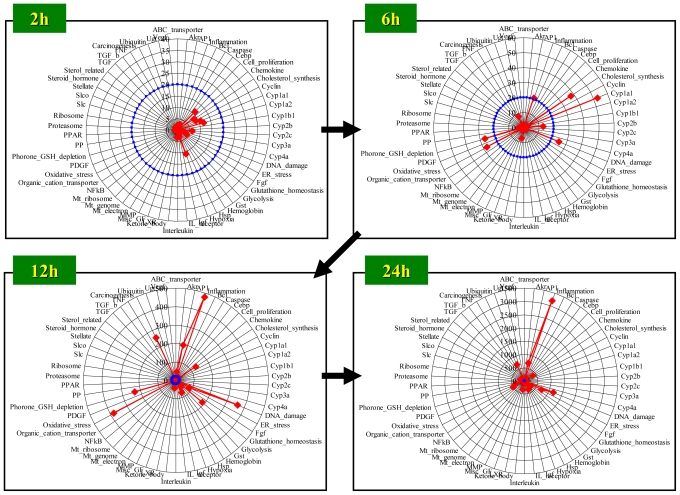
Figure 5.
Time course of D-score: Radar chart presentation. D-scores were calculated for rat livers harvested at 2, 6, 12 and 24 h after bromobenzene treatment, and are presented in a radar chart. The red line indicates the D-score for each gene set, and the blue circle indicates a D-score = 20 for each gene set. Detailed information for the gene sets used can be obtained in a previous report [42].

