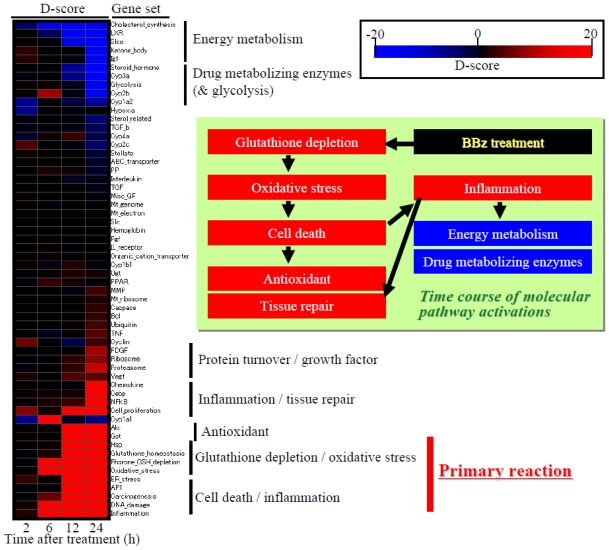
Figure 6.
Time course of D-score: Heat map presentation. Red and blue indicate high and low D-scores, or up- and down-regulation for each gene set, respectively. The heat map indicates that the first trigger invoked by bromobenzene exposure was glutathione depletion and associated oxidative stress responses, followed by cell death, inflammation and up-regulation of antioxidant factors, as well as down-regulation of energy metabolism and drug metabolizing enzymes.

