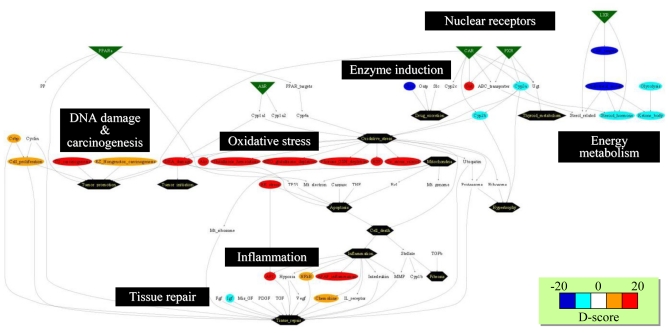
Figure 7.
Network structure presentation of D-scores. Biological and toxicological relationships among gene sets were visualized as a supervised network using GraphViz software. The D-scores calculated for microarray data on rat livers at 24 h after bromobenzene treatment are presented in a network structure using GraphViz software, where red and blue indicate high and low D-scores, respectively. The network demonstrates oxidative stress and DNA damage were induced by bromobenzene treatment, while sterol metabolism was down-regulated.

